Standard International Rates World Map
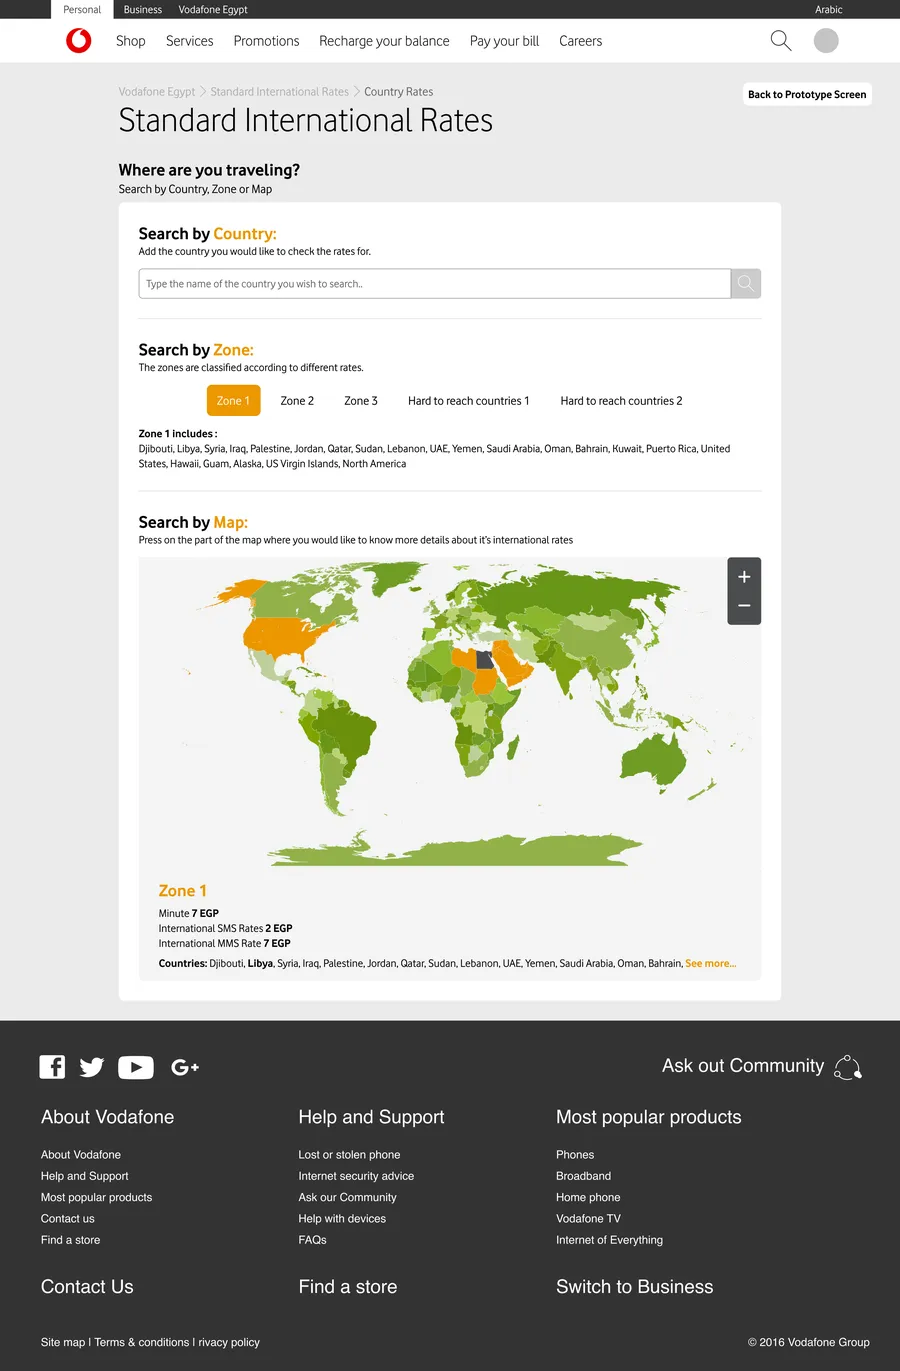
An interactive world map for checking international call rates, hand-drawn country by country after no available mapping tool could export clean, clickable country shapes for developers to build against.
- Role
- Senior UX/UI Designer
- Company
- Vodafone Egypt
- Project type
- Web tool, vodafone.com.eg
Every country on the map hand-drawn as its own clickable layer, since no mapping tool at the time exported clean, country-level shapes
Contents
Overview
This project gave Vodafone Egypt customers three ways to check international call rates before traveling or calling abroad: search by country name, browse by pricing zone, or click directly on an interactive world map. The map itself was the hardest part: it needed every country to be its own clickable shape, and no mapping tool available at the time could export that structure cleanly, so the whole world map was drawn by hand, country by country.
Problem
International rate pages usually rely on a search box or a static list, both of which work but ask a user to already know which country they need before they can find anything.
A clickable map is a more intuitive way to explore rates by region, but building one meant solving a real technical gap: standard map assets came as flat images or region blobs, not individual, developer-usable country shapes.
Goals
- Let a user check rates three different ways (by typing a country, by browsing a zone, or by clicking a country directly on a map) depending on what they already know.
- Make every country on the map individually clickable and accurately shaped, not an approximate region.
- Color-code the map by pricing zone so patterns (which regions are more or less expensive to call) are visible at a glance, not just discoverable one country at a time.
Business Context
International rates are a page every Vodafone Egypt customer traveling or calling abroad eventually needs, so a page that’s slow or frustrating to search directly affects how easily customers can self-serve instead of contacting support. A genuinely interactive, exploorable map made the page useful for browsing, not just for looking up a single known destination.
Research
Constraints
Discovery
The clearest fact driving this project was that AI and automated tooling still can’t easily solve exact, per-country vector mapwork at production quality. This was true then and remains true now.
Turning a flat map into hundreds of individually accurate, clickable vector shapes is precise, manual work that doesn’t have a shortcut.
Strategy
The rates page opens with three clearly separated search paths: a country name search field, a zone-selector with plain-language zone descriptions and country lists, and the interactive map itself. Clicking or tapping any country on the map surfaces that country’s specific per-minute, SMS, and MMS rates alongside its zone classification, with zoom controls for navigating the full map on smaller screens.
UX Decisions
Three parallel ways to find a rate
Country search, zone browsing, and map click each work independently: “I know the country” and “I want to explore by region” are genuinely different user intents, and no single interaction pattern could serve both.
Compare regions before drilling into one country
Zones are color-coded directly on the map, letting a user visually compare regions before opening any single country’s exact rates.
A full country list under every zone
Each zone’s description includes a complete country list, giving anyone a way to browse by zone without touching the map at all.
Wireframes
Structure work here was less about layout exploration and more about sequencing the underlying map production: establishing which countries needed the most manually intensive shape accuracy (small or geographically complex countries) before investing time in the broader map-wide styling and interaction layer.
UI Design
The page opens with a clear “Where are you traveling?” prompt above the three search methods. The map itself uses a muted green-to-orange gradient across zones, with the currently selected country highlighted, set inside a light, card-based layout consistent with the rest of the corporate site, and paired with simple plus/minus zoom controls in the corner.
Motion
Motion stayed minimal and functional: zoom transitions and the state change when selecting a country on the map were kept quick and direct, since the priority was confidence that a click registered the correct country, not any decorative map animation.
Design System
The page uses Vodafone’s existing corporate site visual language (card layouts, orange and green accent colors for interactive states) rather than a map-specific visual system, so the tool reads as part of the same site a user would use to check a bill or find a store.
Engineering Collaboration
Accessibility
Testing
No dedicated usability study is documented for this tool. Validation focused on map accuracy and functionality: confirming that each hand-drawn country shape was clickable, correctly labeled, and returned the right zone and rate information.
Business Impact
By giving customers three legitimate ways to find international rate information, including a genuinely explorable map, the tool aimed to reduce how often customers needed to contact support just to check a rate before calling or traveling abroad.
Results
The tool shipped as a complete rates page: country search, zone search with full country listings, and a fully interactive, hand-drawn, zone-colored world map with per-country click targets and zoom controls.
Metrics
Learnings
Some design problems are really production problems in disguise: the map’s UX (search by country, zone, or map click) was straightforward, but the reason this project took real effort was the underlying deliverable engineering needed, individually accurate, clickable country shapes, which no existing tool could generate.
Reflection
This project is a useful reminder that exact, detail-heavy manual work (drawing 190-plus accurate country shapes) still has a place even in a design practice built around fast iteration and modern tooling. Some problems don’t have a shortcut, and knowing when to commit to the slow, careful version of a task is its own design judgment.
Knowing when to commit to the slow, careful version of a task is its own design judgment.